Conversion Friction Mapping and Invisible Drop-Off Points
Learn how conversion friction mapping reveals invisible drop-off points using page speed data, website performance tools, and load optimization insights.

Conversion Friction Mapping Finding Invisible Drop-Off Points
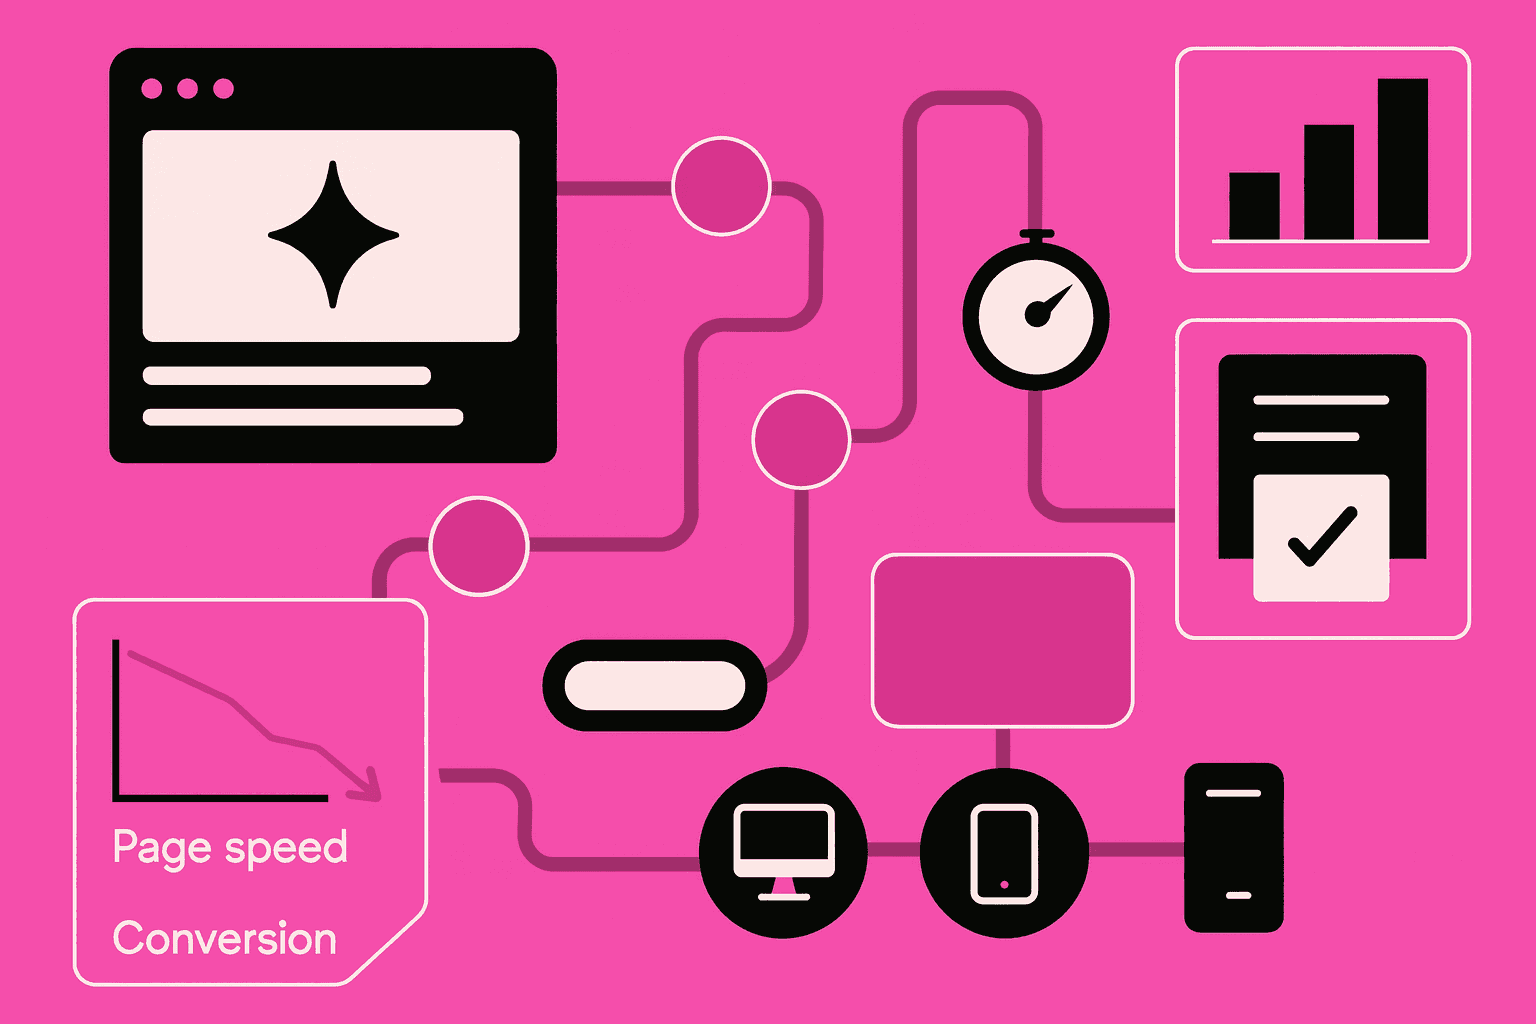
Conversion friction mapping helps teams uncover hidden barriers that slow decisions and reduce conversions. Many drop-offs are not caused by poor messaging but by technical friction, such as website loading time or slow server response time. By mapping these friction points, teams can reduce bounce rate and improve decision flow without redesigning the entire interface.
Why Conversion Friction Is Often Invisible
Many teams rely on surface-level metrics and miss early friction signals. Users rarely complain about delays directly. Instead, they abandon flows quietly when performance issues stack up.
Invisible friction often comes from:
slow page speed during key actions
poor website responsiveness on mobile
delayed server response time
unoptimized assets that increase page load optimization effort
These issues create hesitation long before a clear exit point appears.
The Role of Website Loading Time in Drop-Off Behavior
Website loading time shapes first impressions and decision confidence. Even small delays increase cognitive effort and lower perceived reliability, especially on high-intent pages.
Using Performance Data for Conversion Friction Mapping
Conversion friction mapping connects performance metrics with user behavior. Tools like google pagespeed insights and speedtest page web reveal where delays occur during real user flows.
Key data sources include:
website speed audit results
website performance tools dashboards
mobile speed optimization reports
asset-level loading analysis
When combined with behavior funnels, this data highlights invisible drop-off points.
Page Speed as a Psychological Signal
Page speed is not just technical. Fast responses signal trust and control, while delays create doubt. This is why page speed improvements often outperform visual changes.
Common Friction Points Identified Through Mapping
The table below shows frequent friction sources and how they impact conversions.
Friction Source | Performance Indicator | Conversion Impact |
|---|---|---|
Large media files | Slow page speed | Increased bounce rate |
Uncached requests | High server response time | Drop-offs before form completion |
Mobile layout shifts | Poor website responsiveness | Lower mobile engagement |
Heavy scripts | Failed page load optimization | Delayed user actions |
Missing lazy loading | Inefficient asset loading | Slower perceived speed |
This mapping helps prioritize fixes based on real impact.
Reducing Conversion Friction Without Redesign
Most friction issues can be solved without changing layouts or copy. Technical improvements often deliver faster results.
Effective actions include:
optimize images for the web to reduce load size
apply lazy loading techniques for non-critical assets
improve mobile speed optimization for key flows
monitor improvements with website speed audit tools
Each fix removes hesitation and shortens the decision path.
Measuring Impact After Optimization
After changes, track improvements using website performance tools and behavior funnels. Reduced drop-offs confirm that friction, not intent, was the main blocker.
Conclusion
Conversion friction mapping reveals drop-off points users never mention but always feel. By analyzing page speed, website loading time, and performance data, teams can remove invisible barriers that quietly reduce conversions. Small technical optimizations often deliver outsized gains when friction is mapped and resolved systematically.